
Inspection Data Management for Asset Owners
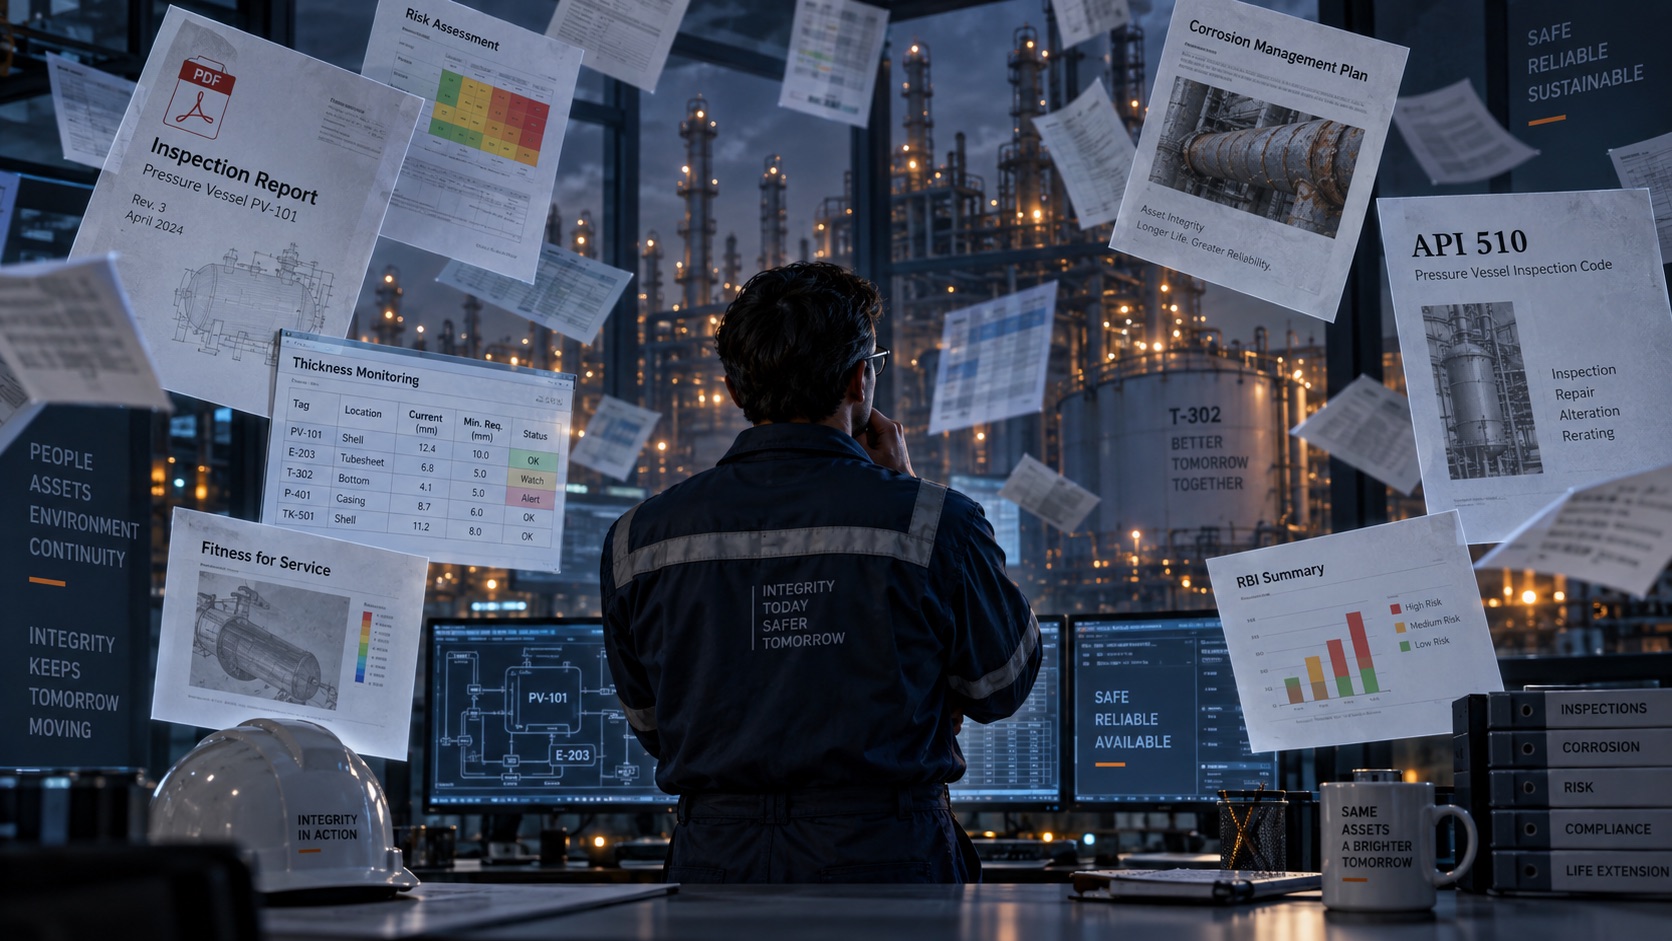
Ask most plant integrity teams whether their inspection program is in good shape and the honest answer is: the inspections are. Qualified technicians show up, take the readings, and write solid reports. The work itself is rarely the weak link.
The weak link is what happens after the report lands. It gets emailed to a coordinator, saved to a shared drive, maybe summarized into a spreadsheet, and then it sits. Six months later someone needs to answer a straightforward question, and the answer takes three days to assemble.
That delay is where the opportunity sits. When an asset’s condition is a minute away instead of three days away, the whole program shifts from reacting to planning.
| $500K+ Per hour a refinery can lose to unplanned downtime |
39% Of the maintenance day spent waiting on equipment, people, and information |
100% Share of API 510, 570, and 653 programs the owner-user is accountable for, not the vendor |
🏭 The Gap Isn’t the Inspection. It’s What Happens to the Data Afterward.
Inspection data on most sites doesn’t live in one place. It lives in four, and each one loses a little more of it:
|
📄
The vendor PDF Complete, accurate, professionally formatted, and completely unusable as data. Every number in it has to be retyped before it can be compared to anything. |
📧
The email attachment The only copy of a 2019 tank bottom report is in a mailbox belonging to a coordinator who left in 2022. Nobody knows that yet. |
|
🗂️
The shared drive Organized by year, then by vendor, then by whoever set up the folder. Finding one circuit’s history means opening thirty files to check which ones mention it. |
📊
The tracking spreadsheet Maintained by one person, by hand, from the PDFs. It is the most useful artifact you have and the most fragile. It is also almost certainly out of date. |
None of this is negligence. It is what happens when a program grows one inspection at a time over fifteen years without a system of record underneath it. The data is technically all there. It just can’t be asked a question.
🔀 What Six Vendors and Six Report Formats Actually Cost You
Most asset owners use more than one inspection contractor. It is good procurement practice: it keeps pricing honest, covers more methods, and gives you coverage across sites. But every firm brings its own reporting conventions with it.
- ✕ TML numbering. Vendor A’s CML-14 and Vendor B’s TML-014 may or may not be the same point on the same elbow. Nobody can prove it years later.
- ✕ Equipment naming. “V-101,” “Vessel 101,” and “101-V” are three records for one asset, so its history splits three ways.
- ✕ Units and precision. Mixed inches and mils, two decimals versus three. Small inconsistencies become large corrosion-rate errors.
- ✕ Findings language. One report says “monitor,” another says “recommend repair at next opportunity.” Neither is a trackable action item.
- ✕ Delivery format. PDF, scanned PDF, Excel, and one vendor’s proprietary portal you lose access to when the contract ends.
The result is that your inspection history is only as coherent as your last procurement decision. Change vendors and you don’t just change crews. You introduce a seam in the data that nobody will notice until the next audit or the next failure.
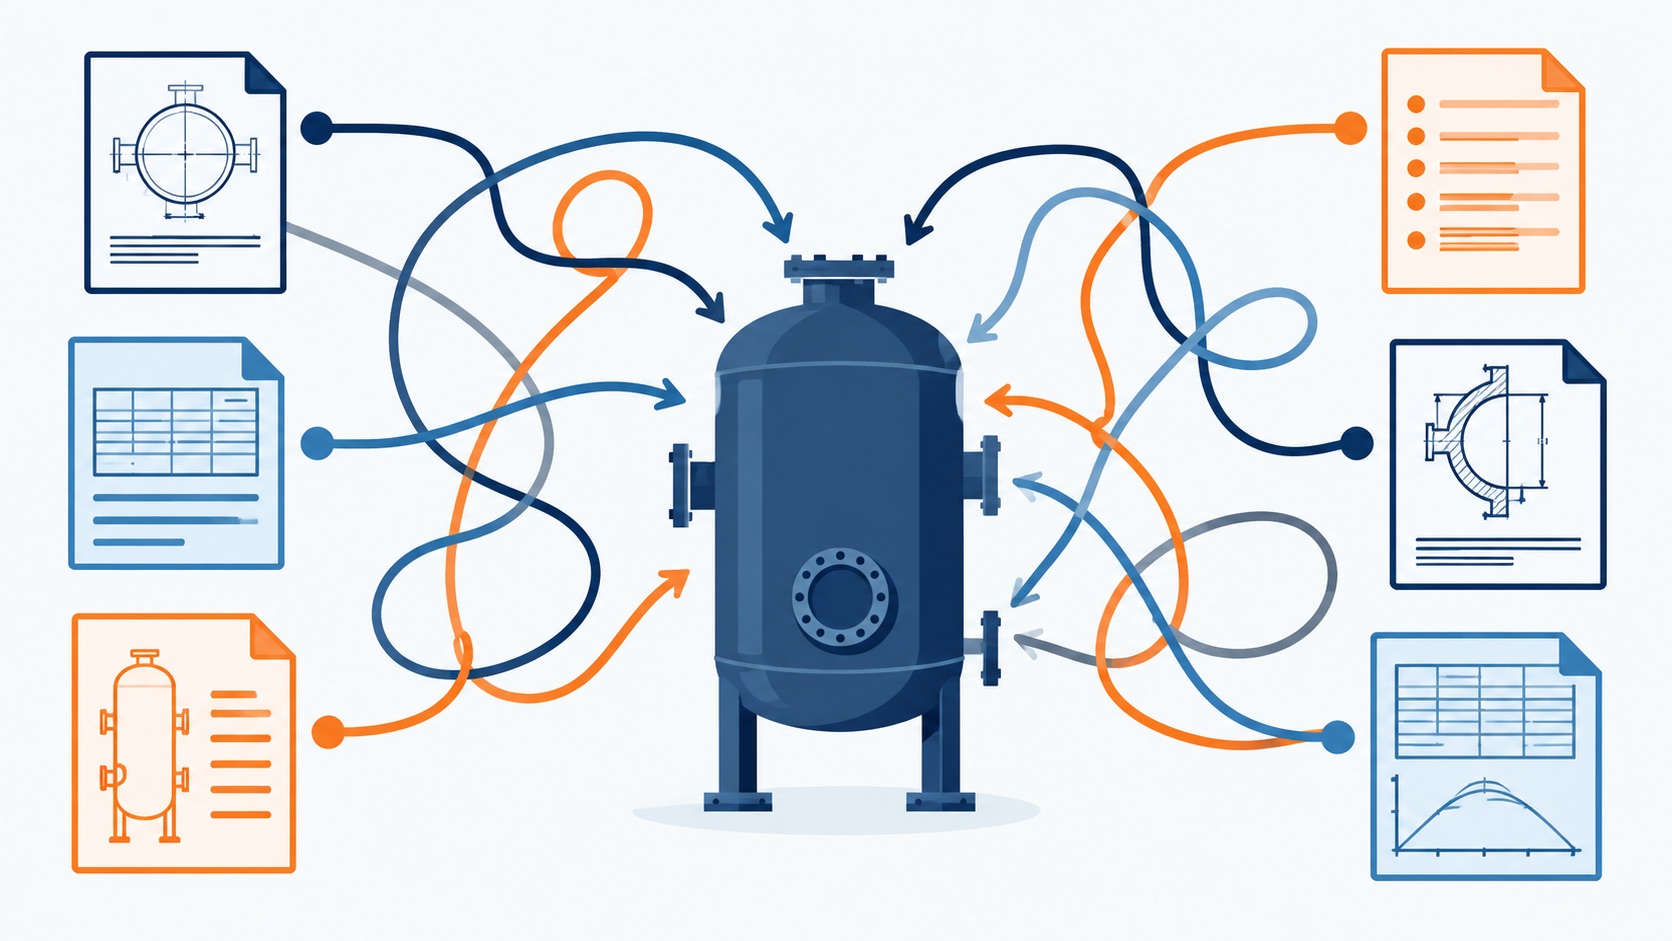
📈 Corrosion Rate Trending Is Impossible Without a Common Record
This is where fragmented data stops being an inconvenience and starts being a safety issue. Remaining life is a simple calculation: take the wall you have above minimum, divide by how fast you are losing it. Both inputs depend on comparing readings taken years apart, at the same point, measured the same way.
When those readings sit in incompatible PDFs from different contractors, you can’t reliably do that. So teams fall back on the conservative default: assume the worst corrosion rate, shorten the interval, and inspect more often than the asset actually needs.
Illustrative. You collected and paid for every reading in both cases. In the first, most of them can’t be matched to a prior reading at the same point with enough confidence to compute a defensible corrosion rate. You bought the data twice and used it once.
That conservatism feels safe, and in one direction it is. But over-inspection burns budget and outage hours on assets that are fine, which means less of both for the assets that aren’t. Bad data doesn’t just hide risk. It misallocates the money you spend managing it.
“Advanced inspection data management systems analyze and generate actionable insights from data that empower operators to make more informed inspection, mitigation, and repair decisions.”
📋 The API 510, 570, and 653 Audit You Can’t Prepare For in a Week
Here is the part that surprises people who assume their contractor carries the compliance burden. Under API 510 for pressure vessels, API 570 for piping, and API 653 for storage tanks, the owner-user is responsible for the inspection program. Not the inspection company. You own the intervals, the basis for those intervals, and the records that justify them.
Which means when an auditor, an insurer, or a regulator asks a question, “our vendor has that” is not an answer. It is a finding.
|
❌ THE PDF ARCHIVE
Auditor: “Show me the thickness history and interval basis for this circuit since 2016.” You: “Give us a few days. Two of those years were a different contractor and we’ll need to request the files back from them.” Auditor’s takeaway: If the records supporting the interval aren’t at hand, was the interval ever really justified? The scope of the audit widens. |
✅ THE CENTRALIZED RECORD
Auditor: “Show me the thickness history and interval basis for this circuit since 2016.” You: “Here.” Full reading history, corrosion rate, remaining life, inspector certifications, and equipment calibration, on screen in under a minute. Auditor’s takeaway: This program is controlled and evidenced. The audit stays narrow and moves on. |
The difference isn’t how good your inspections were. In both columns they were excellent. The difference is whether you can prove it on demand, and proof that takes a week is not proof. It’s a reconstruction.
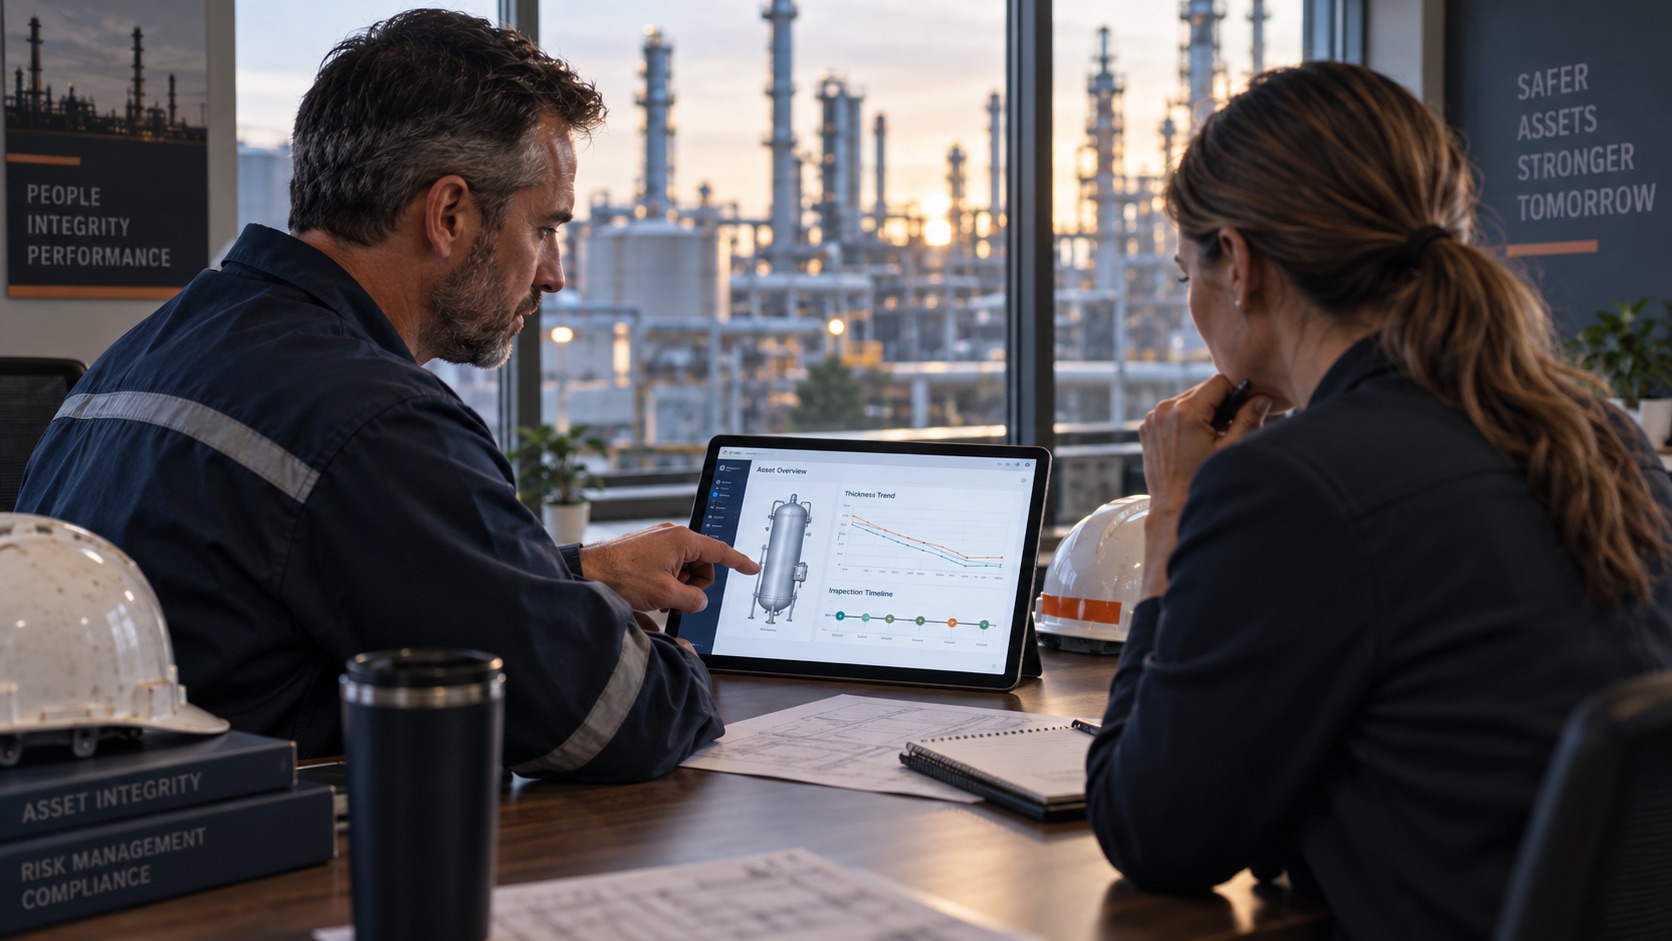
⚖️ Two Plants, Same Assets, Different Risk Posture
Put two sites side by side. Same equipment count, same codes, same quality of field work, same inspection spend. The only difference is where the data lands when the vendor is finished.
Plant A and Plant B spend roughly the same money on inspection every year. Only one of them is buying a picture of the plant. The other is buying individual photographs and stacking them in a drawer.
🔁 The Findings That Die in a Folder
Of everything on this page, this is the one that should keep you up at night. Every inspection report contains recommendations. Monitor this. Repair at next opportunity. Re-inspect in twelve months. Those recommendations are the entire point of the inspection.
And in a folder-based program, a meaningful share of them are never formally tracked to closure. Not because anyone ignored them, but because the recommendation lived on page 14 of a PDF and the person who read it moved on to the next job.
- ✕ You are now on record as having known. The report is discoverable. The follow-up isn’t.
- ✕ Insurers and regulators look here first. After an incident, the question is rarely “did you inspect?” It’s “what did you do about what you found?”
- ✕ The next inspection may not repeat it. A different contractor with no access to the prior finding starts from scratch.
- ✕ It distorts your risk ranking. An asset with three open findings and one with none look identical if nobody is counting.
Closing the loop is not a software feature so much as a discipline, but the discipline is close to impossible without a system that carries every recommendation forward as a live item with an owner and a date. A finding is not closed because time passed. It is closed because someone did something and recorded it.
🏗️ Turnarounds: Where Bad Inspection Data Gets Expensive Fast
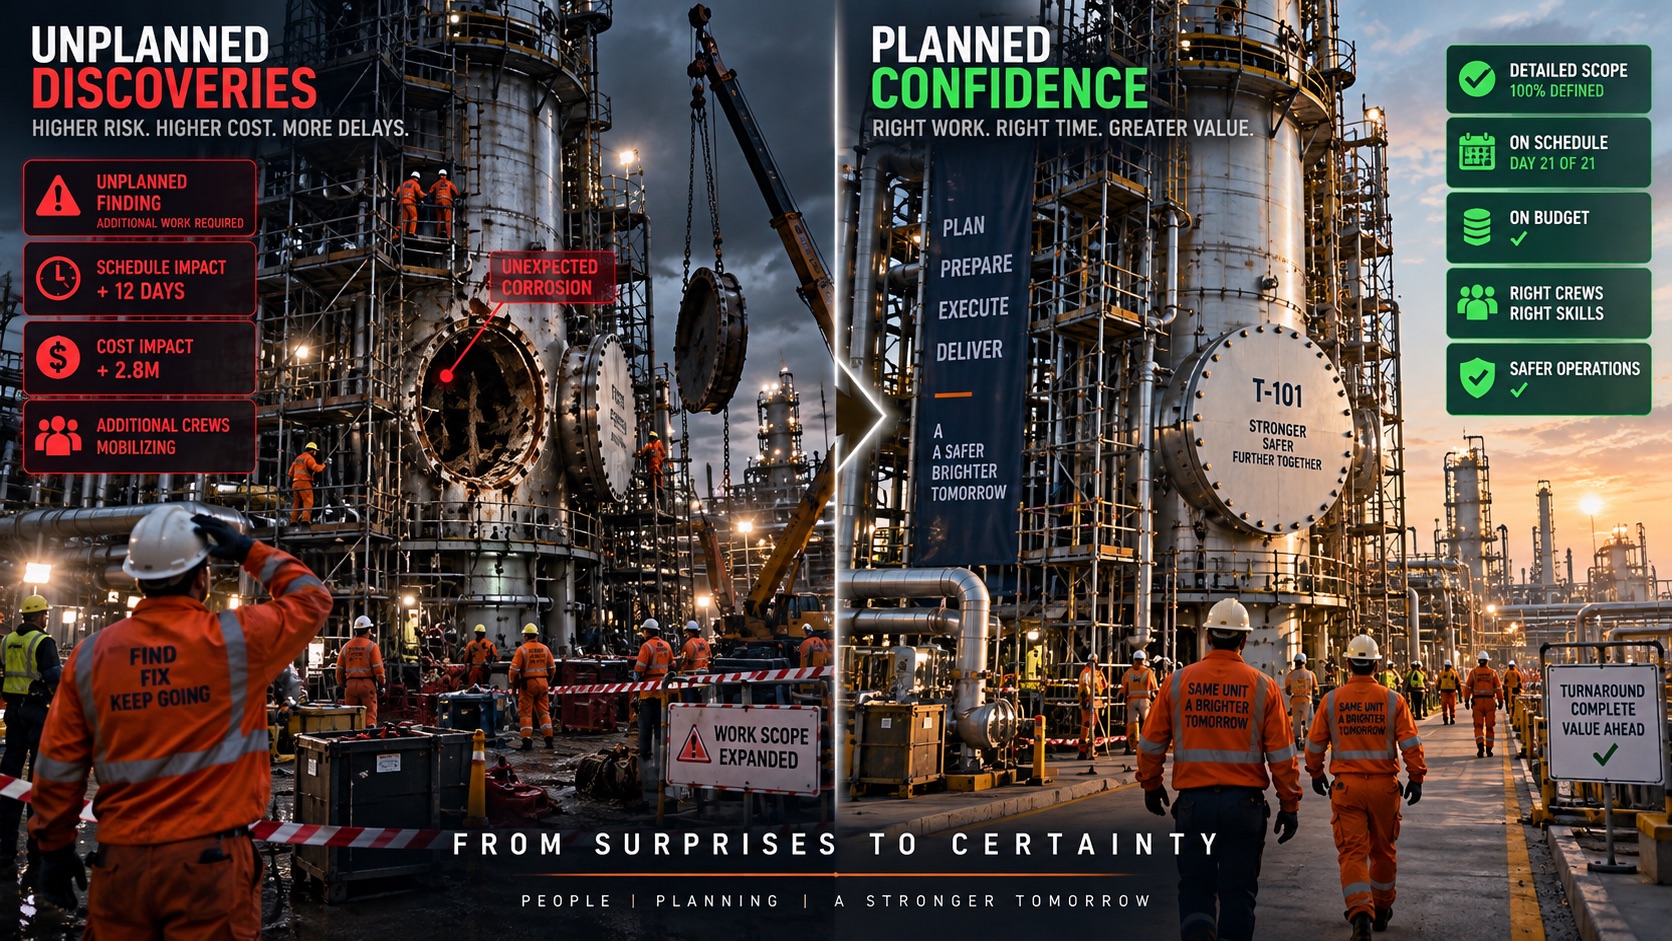
Turnaround scope is built months in advance from what you believe the condition of the plant to be. If that belief is assembled from PDFs and a spreadsheet, the scope will be wrong in both directions at once: you will carry work that didn’t need doing, and you will discover work you didn’t plan for.
Discovery work during an outage is the most expensive work there is. The unit is down, the contractors are mobilized, the critical path is fixed, and now something needs engineering, materials, and a decision. Every hour of that is charged against a facility that, in refining, can lose more than half a million dollars an hour when it isn’t running.
“Oil and gas refineries can lose more than $500,000 per hour to unplanned downtime, a figure that has climbed sharply in recent years.”
Against that number, the cost of getting your inspection data into one trustworthy place stops looking like an IT project and starts looking like the cheapest insurance on the site.
🗺️ Building an Inspection Data Management Program in Four Phases
The reason most sites never fix this is that “digitize fifteen years of inspection history” sounds like a two-year capital project. It doesn’t have to be. You do not need to backfill everything to start getting value, and the first phase is mostly a procurement decision rather than a technology one.
Define your asset and TML naming convention, and put it in the scope of work for every inspection contract going forward. New data arrives in your format, into one system, from every vendor. Nothing new gets lost from this point on.
Don’t digitize everything. Digitize the highest-consequence circuits and equipment first, and only as far back as you need for a defensible corrosion rate. Typically two or three prior readings per point.
Pull every open finding into one tracked list with an owner, a due date, and a closure record. This is usually the phase where a site discovers items it did not know were still open.
With clean trending and a live findings list, intervals can finally be set on evidence. Inspect the assets that need it more, the ones that don’t less, and put the savings where the risk actually is.
Phase 1 alone changes the trajectory. Every month you delay it is another month of data arriving in a format you will eventually pay someone to clean up.
🎯 Bottom Line: You Can’t Manage Risk You Can’t See
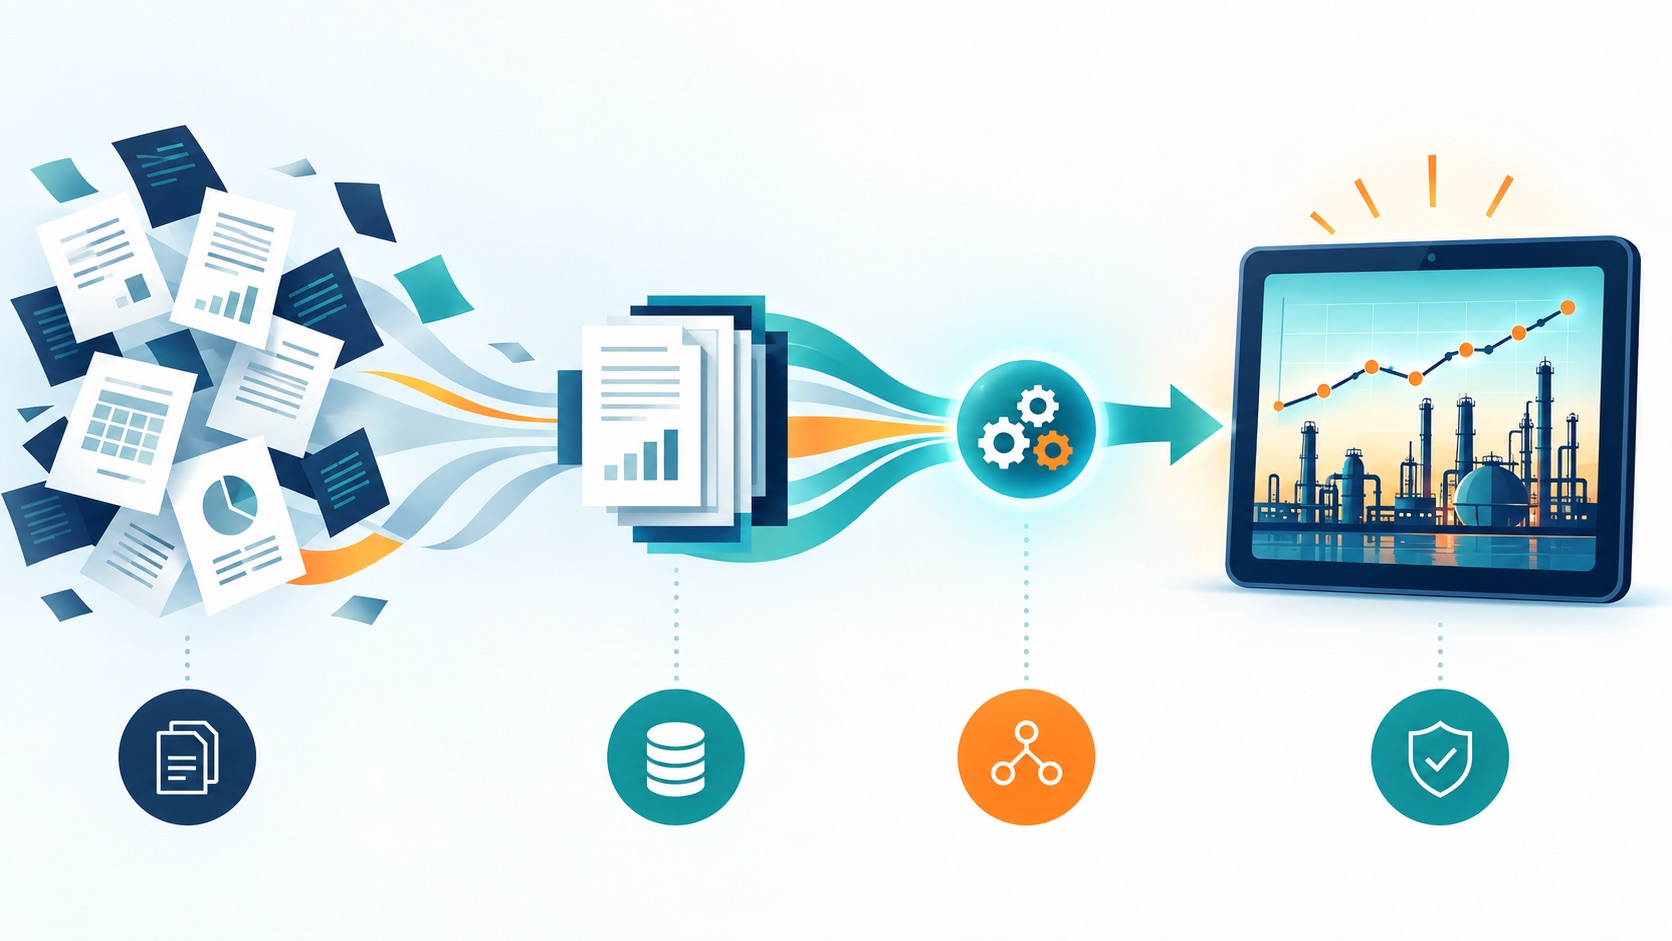
Asset owners rarely have a shortage of inspection data. They have a shortage of usable inspection data. The readings were taken, the reports were written, the invoices were paid. What was never built was the connective layer that turns thousands of individual observations into a view of the plant.
Without that layer, you are paying full price for inspection and collecting a fraction of the value. With it, the same spend tells you which assets are degrading, how fast, what is still open, and what your next turnaround actually needs to cover. Purpose-built NDT inspection and reporting software is how that layer gets built, and it starts with standardizing what comes back from the field, which is the subject of Win More Work with Better Reports. If your program still runs on workbooks, Why Excel Isn’t Enough for Today’s NDT Inspections covers where that breaks down.
The assets don’t care how the data is stored. They corrode on their own schedule either way. The only question is whether you find out from a trend line or from an incident.
❓ Frequently Asked Questions
What is inspection data management?
Inspection data management is the practice of collecting inspection results into a single structured record per asset, rather than storing them as standalone reports. It lets an owner trend thickness readings over time, calculate corrosion rates and remaining life, track findings to closure, and produce evidence for an audit without reassembling it from files.
Who is responsible for the inspection program under API 510, 570, and 653?
The owner-user is. The inspection contractor performs the examination and reports the results, but responsibility for the program, the inspection intervals, the basis for those intervals, and the retained records sits with the asset owner. That is why “our vendor has the records” does not satisfy an auditor.
We use several inspection vendors. Can their data live in one system?
Yes, and it is usually the fastest improvement available. The key is to define your own asset and TML naming convention and make reporting into your system part of the scope of work in every inspection contract. Vendors then deliver into your format, so your history stays continuous even when the contract changes hands.
Do we have to digitize years of historical inspection reports first?
No. Start by capturing all new inspections in one system so nothing further is lost, then backfill selectively. Most sites only need two or three prior readings per monitoring location on their highest-consequence assets to establish a defensible corrosion rate. Full historical conversion is optional and can happen over time.
How does better inspection data reduce cost, not just risk?
Two ways. It removes over-inspection on assets that conservative assumptions had flagged unnecessarily, freeing budget and outage hours. And it improves turnaround scope accuracy, which cuts the discovery work that gets found once the unit is already down and is by far the most expensive work to execute.
You already paid for every reading in that archive. The only thing left to decide is whether you ever get to use them.
Book a one-on-one demo and we’ll show you how asset owners pull every vendor’s inspection data into a single record, with trending, findings tracking, and audit evidence attached as the work happens.
Work on the inspection services side? See how digitalization changes what an NDT company is worth.